

Stop guessing. Start data-sniping trends before your competitors even see them coming.
Note
In dropshipping, there's a 4–8 week window between a product gaining traction and becoming oversaturated. Winners spot the signal before it becomes noise.Click here to start dropshipping now with DSers
This guide covers DSers' Product Research feature — filters, likes ranking tiers, subscription access, and the full detail drawer workflow (Google Trends, Amazon pricing, supplier costs, and ROI).
The "I Have No Idea What to Sell" Starting Point
Go to: DSers > Product Research > Featured TikTok Ads
What you'll see: Active ad videos from TikTok, organized in one place. No manual hunting. No guesswork.
What to scan first: Likes, Comments, and Shares on every card.
Signal tip: High shares + moderate likes? That's often stronger than likes alone. People want to pass it along.
Filters That Actually Save You Time
Rule: Start with region and industry. Then layer in engagement.
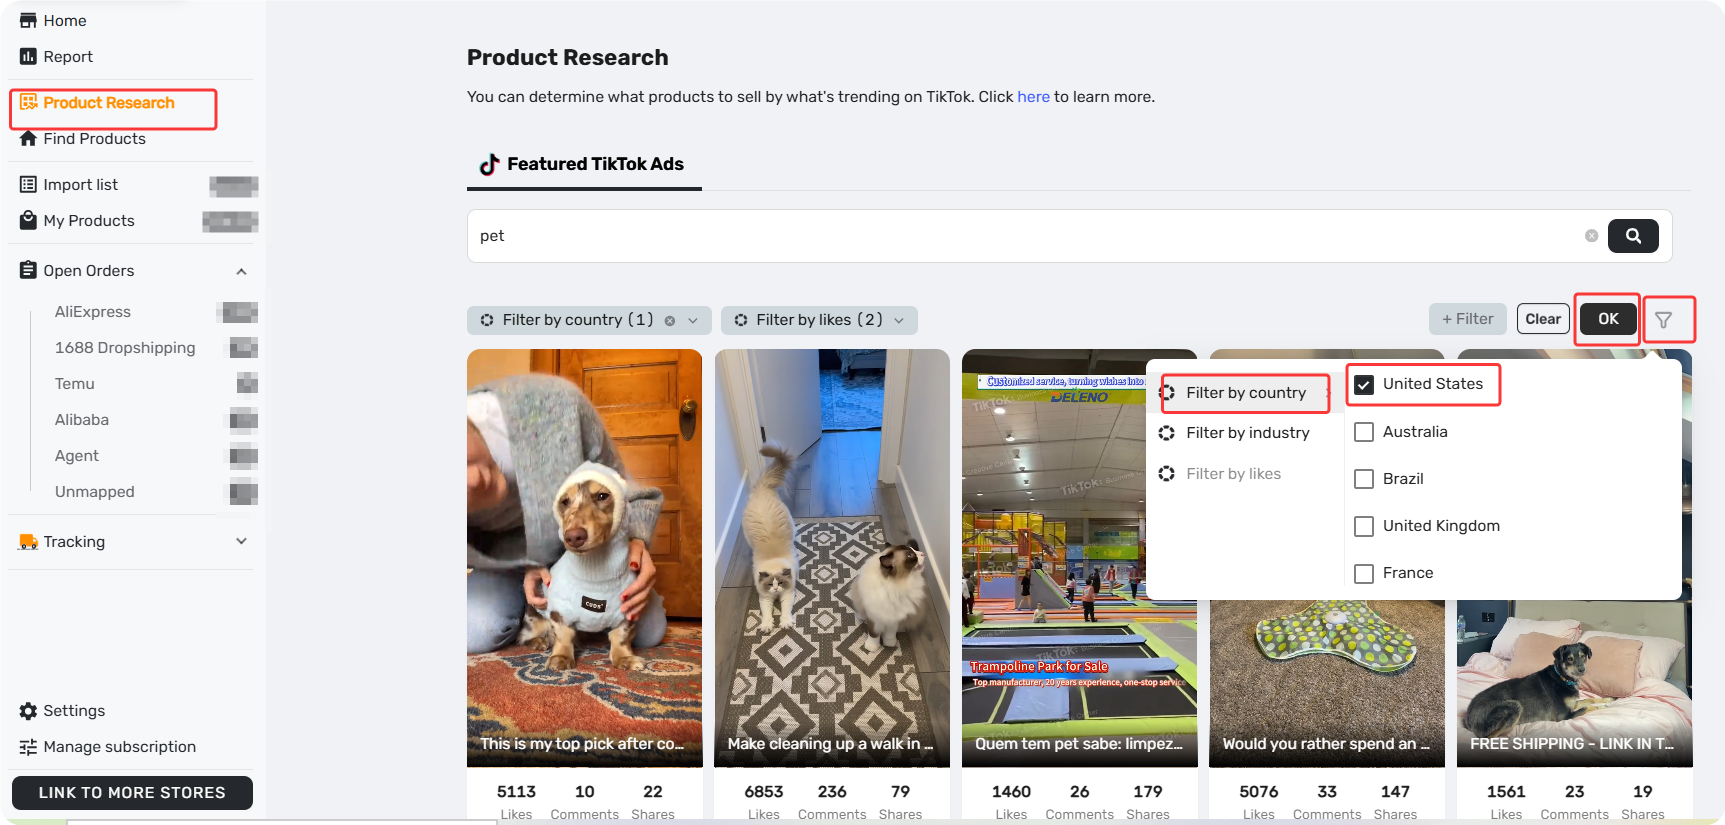
| Filter | Options | Notes |
|---|---|---|
| Region | US, UK, France, Brazil, Australia | Nothing selected by default |
| Industry | Pet life, Apparel & Bags, Electronics, Home & Living, Auto, Beauty, Auto, Baby, Phones & Computers, Sports | Default: All (supports multiple) |
| Likes ranking | Top 1%-30% / 31%-60% / 61%-100% | Based on likes count across all ads |
What is "Likes ranking" and why filter by it?
It measures which ads get the most likes compared to everything else in our database. Higher ranking = more engagement. And engagement matters because likes are public votes.
An ad in the Top 1%-30% is proven:
- It's survived the "does anyone care?" test
- The creative hook is working — you can study and adapt it
- It's gaining momentum before most dropshippers notice
That's social proof you can't fake. Study the creative. Adapt it. Get in early.
What your plan unlocks:
- Basic: Top 61%–100%
- Advanced: Top 31%–60%
- Pro & Enterprise: Top 1%–30%
What You'll Find Inside the Detail Drawer
Filters help you narrow the list. But finding a promising video is just the first step. The real research starts when you open it up.
Click Learn more on any video card. The detail drawer opens.
Video Data — What the Numbers Tell You
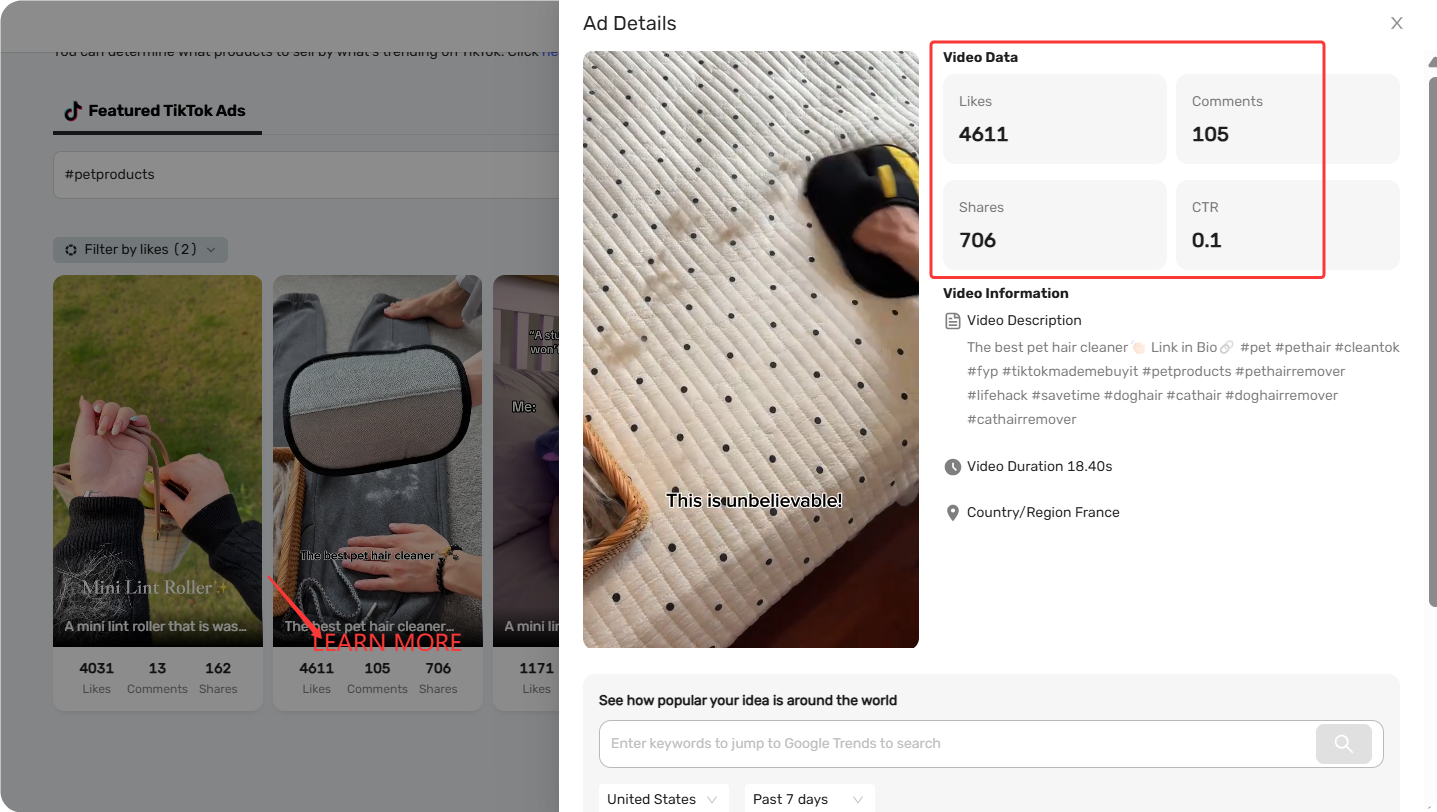
| Data Point | Why It Matters |
|---|---|
| Likes | Broad appeal |
| Comments | Real engagement — questions or praise you can't fake |
| Shares | Strongest signal. People share products, not just entertainment |
| CTR | Tells you if the creative converts, not just entertains |
Quick scan: High shares + moderate likes? Often better than high likes alone.
Inside the Detail Drawer — What Each Tool Does
| Feature | What It Does | When to Use It |
|---|---|---|
| See how popular your idea is around the world | Checks search demand over time and across regions by Google Trends | Look for rising demand — not flat or falling |
| Amazon pricing reference | Shows what the product sells for on Amazon | Check if other sellers are offering this product on Amazon and what their prices are for reference |
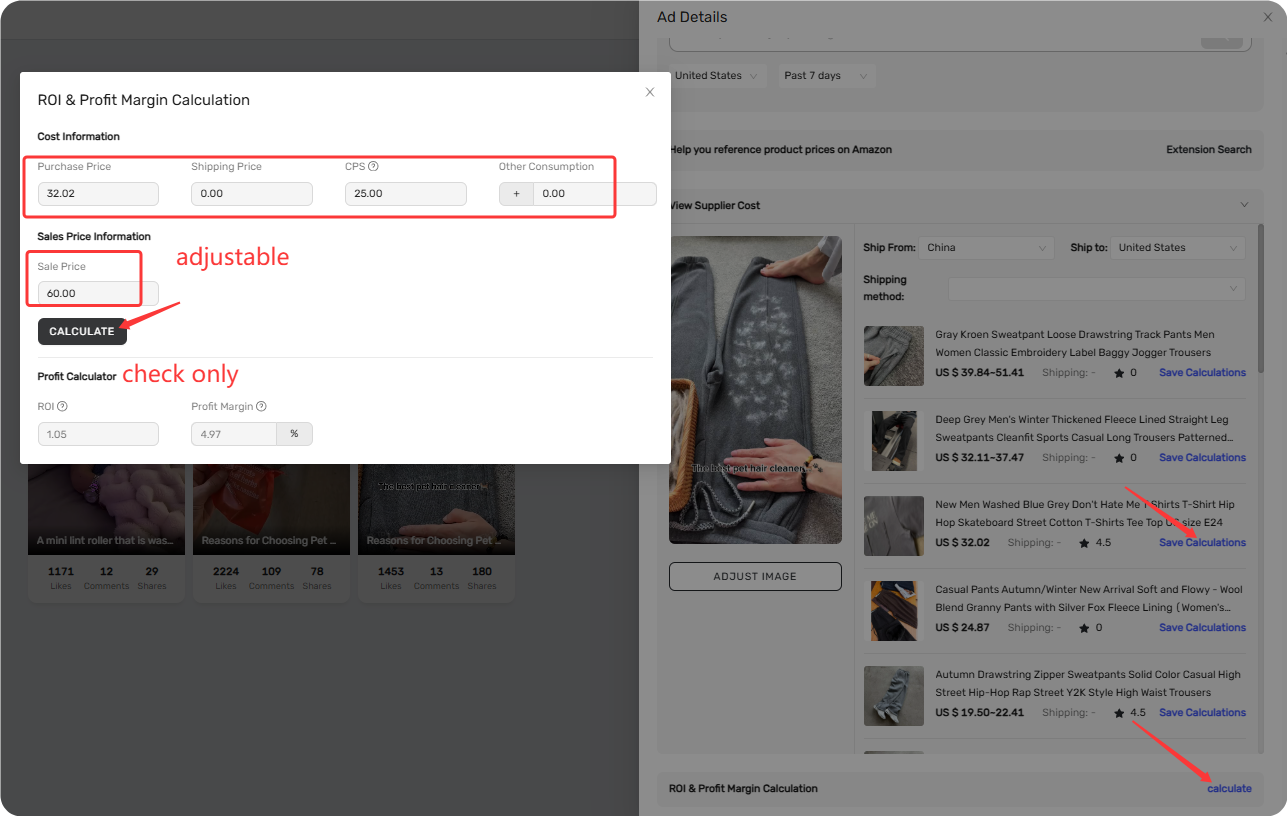
| View Supplier Cost | Pulls AliExpress supplier costs + shipping | Before calculating profit. You need the real cost |
| ROI & Profit Margin | Auto-calculates profit based on cost and selling price | When you've found a supplier via View Supplier Cost and want to see what your profit would be if you sell this product |
One flow: Google Trends (is demand rising?) → Amazon (room for margin?) → Supplier Cost (what you pay) → ROI (will you make money?)
FAQ Section
Here are some common questions about Product Research, Featured TikTok Ads, and finding trending products in DSers.
| Get Started Now to Grow Your Online Business with the DSers! |


 Company
 Why Choose DSers
 Blog
Blog
 Help Center


